Modes of transport compared
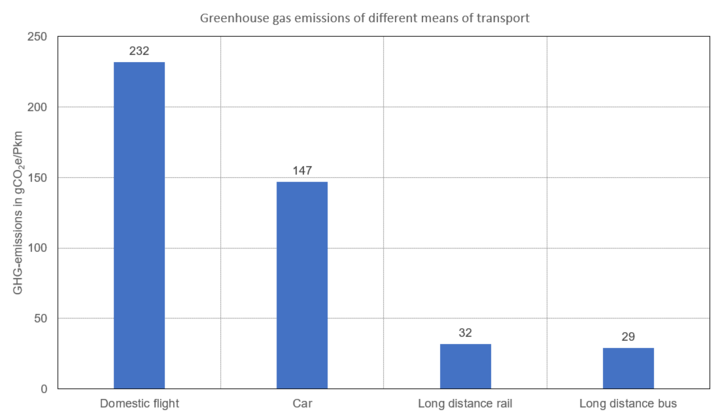
A direct comparison of the average greenhouse gas emissions of different modes of transport clearly shows that flying has the largest climate impact. The total greenhouse gas emissions of a journey are made up of the specific emissions and the distance travelled.
According to the German Federal Environment Agency’s Transport Emission Model (TREMOD, Version 6.03), the greenhouse gas emissions per passenger kilometre (pkm) from flights within Germany are around seven to eight times higher than those of more climate-friendly modes of transport such as long-distance trains and buses. But even compared to passenger cars, the specific emissions of domestic flights, i.e. the emissions in relation to the passenger kilometres (pkm) travelled, are around 60 % higher on average.

Source: Oeko-Institut 2020 based on TREMOD Version 6.03 (Transport Emission Model of the German Federal Environment Agency)
What are the relevant factors of the carbon footprint?
The specific greenhouse gas emissions per passenger kilometre basically depend on several factors:
-
the energy consumption of the vehicle per kilometre,
-
the type of fuel or energy source used, and
-
the capacity of the means of transport and the utilization of capacity.
The energy consumption and the type of fuel used determine the total greenhouse gas emissions of a means of transport. The energy consumption of an aircraft depends largely on its characteristics, e.g. the type of aircraft, type of engine, weight of the aircraft and its equipment. The flight mode and external conditions also influence energy consumption: What is the capacity utilization? What cruising speed is selected? What are the ambient conditions, e.g. wind?
Similar factors generally also influence the energy consumption of other means of transport. For example, a passenger car with a petrol engine consumes more energy than a comparable vehicle with a diesel engine. A heavy, high-performance luxury vehicle generally consumes more than a light compact car. A train with an electric drive system is more efficient than one with a diesel drive system.
The influence of the fuel used on greenhouse gas emissions depends on two main factors:
-
the amount of carbon in the fuel in relation to the energy content – this determines the direct CO₂ emissions;
-
emissions that occur during fuel production and supply, the so-called upstream chain.
The German Federal Environment Agency’s TREMOD model yields the following values for 2018:
-
kerosene: direct CO₂ emissions: 73.3 g CO₂/MJ; greenhouse gas emissions from upstream chain: 15.6 g CO₂eq/MJ.
-
petrol: direct CO₂ emissions: 74.9 g CO₂/MJ; greenhouse gas emissions from upstream chain: 12.4 g CO₂eq/MJ.
-
diesel: direct CO₂ emissions: 73.9 g CO₂/MJ; greenhouse gas emissions from upstream chain: 12.5 g CO₂eq/MJ. If, for example, long-distance train journeys are powered by electricity or an aircraft is operated purely electrically, no direct emissions are produced. The total emissions are attributable to electricity generation at the power plant and the upstream chain of the energy sources used there. These emission levels depend to a large extent on the emission levels in the electricity mix in the country concerned, i.e. the share of renewable energies in electricity generation.
Other important factors in the context of the carbon footprint are the capacity and capacity utilization of the means of transport. Capacity is determined by the aircraft model and the seating selected: if the distance between seats is small, more passengers can be transported; a larger distance between the seats as in business class in turn reduces capacity. The emissions calculator of Atmosfair takes into account this difference space requirement: for example, it multiplies the average emissions by a factor of 0.8 (economy class), 1.5 (business class) or 2 (first class). First class flights thus generate about two and a half times as many emissions as economy flights.
Goods are often transported in the belly of passenger aircraft as cargo or belly freight, so the aircraft’s emissions must be divided between freight and passengers. In practice, this is often carried out based on the transport volume in ton kilometers, each passenger including baggage is counted as 100 kg.
A lower capacity and/or capacity utilization – which arose, for example, during the Covid-19 pandemic – thus increases the environmentally harmful effect of a flight per person, because the total emissions are distributed among fewer travellers (and goods transported along with them).
What distinguishes greenhouse gas emissions in air transport?
There are some key particularities in air transport compared to other modes of transport. For example, the emissions are dependent on the distance travelled due to several mechanisms.
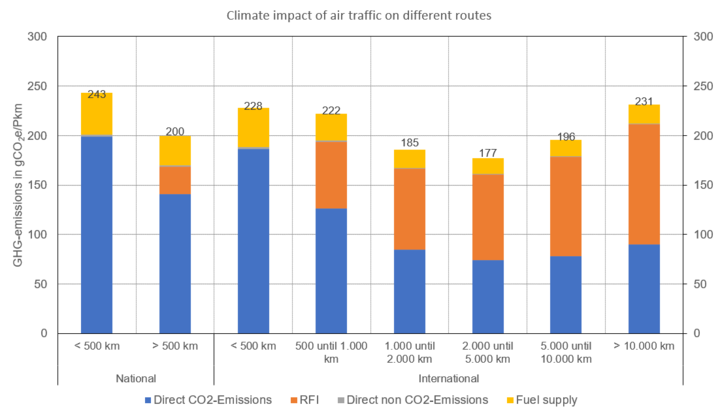
The figure shows that over short distances CO₂ emissions account for the largest share of the harmful impact of air transport on the climate. The energy-intensive take-off and ascent have a particularly strong impact in flights over short distances. Over long distances, in contrast, the indirect harmful effects on the climate account for approximately half of the total climate impact of a flight, because non-CO₂ effects such as the warming effects due to cloud formation play a greater role at higher flight altitudes. Per capita emissions increase for long-haul flights since more fuel must be transported and therefore fewer passengers and less belly freight can be carried. Distances between 1,000 and 5,000 km have the lowest total climate impact converted into greenhouse emissions per passenger kilometre .

What influences the greenhouse gas emissions of aviation?
Take-off and ascent, cruise altitude and fuel quantity have a direct impact on the greenhouse gas emissions of aircraft:
-
Take-off and ascent
During the take-off and ascent phases, aircraft consume a particularly large amount of energy as the aircraft accelerates and altitude increases. These energy-intensive phases are more significant in flights over short distances than longer ones. The specific energy consumption per kilometre decreases over longer distance due to this effect.
-
Cruising altitude
Non-CO₂ effects occur at high cruising altitudes. The longer the flight distance, the larger the share of the flight distance travelled at these high altitudes. Thus, specific emissions from non-CO₂ effects increase with distance.
Another particularity of air transport is that, compared to the other modes of transport, it is less dependent on fixed route infrastructure. In practice, this often results in shorter journeys. It is usually assumed that the distance flown is made up of the direct route (great circle distance or as the crow flies on a sphere) and a detour of, for example, 50 km (Atmosfair) or 95 km (DIN EN 16258). If 50 km is taken as a basis, the distance for the example journeys from Frankfurt to Brussels, Paris and Barcelona is between 10% and 17% longer by land than by plane. Air transport may have the advantage that a shorter distance has to be covered than in road or rail transport. Therefore, it is important that comparisons of different modes of transport take account not only of the emissions per person kilometre; rather, these values and the distances travelled should be used to calculate the total emissions of a journey.
-
Fuel quantity
The farther the destination is from the starting point, the more fuel the aircraft must carry. This has two effects. Firstly, energy consumption increases with the increasing distance because of the additional weight of the fuel. Secondly, for a given maximum takeoff weight (MTOW), the amount of fuel used can reduce the amount of cargo that can be carried as belly freight. The capacity of the aircraft therefore decreases. Specific fuel consumption and specific emissions per passenger kilometre thus rise as the distance increases, because the total energy consumption and emissions are distributed over the utilized capacity.
On long-haul flights, it can therefore make sense to make a stopover for refuelling halfway along the route. In the case of a Boeing 777-300, this leads to a reduction in specific energy consumption for total distances of around 5,500 km or more. It should be noted that a stopover also results in higher ground-level air pollutant emissions and noise pollution.
Modes of transport compared
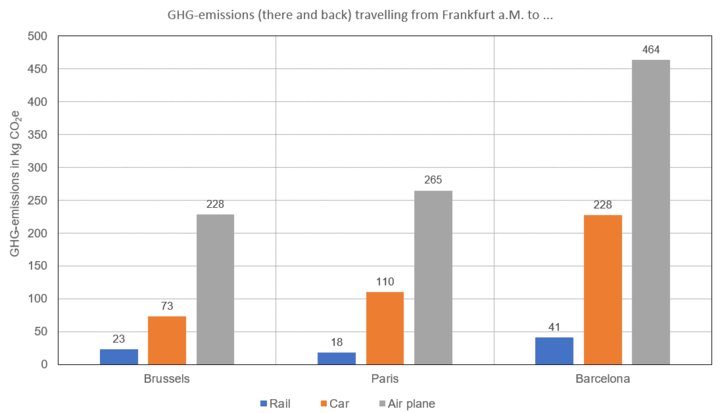
The following figure shows the greenhouse gas emissions for example trips from Frankfurt/Main to Brussels, Paris and Barcelona by train, car and aeroplane. These were calculated using EcoPassenger’s online calculation tool and considers both the upstream chains from fuel supply and the non-CO₂ effects of flights at high altitudes. An average capacity utilization of aeroplanes and trains is assumed; for passenger cars, a current mid-range vehicle with a petrol engine and two passengers is assumed.

Source: Oeko-Institut based on ecopassenger.org
Long-distance rail travel performs best in this comparison: rail passengers cause less than 10% of the greenhouse gas emissions of holidaymakers travelling by plane. The low emissions from rail travel also result from the low share of electricity from coal-fired power plants in France. Passenger travelling by car cause greenhouse gas emissions that are about two-thirds lower than those caused by passengers travelling by plane to Brussels. For the longer trip to Barcelona, the lower emissions compared to air travel drop to about half.
The high speed of aeroplanes also makes it possible to travel to faraway destinations that cannot be reached by other means of transport or can only be reached if the significantly longer travel time is not an obstacle. Such long-distance travel made possible by air travel causes very high greenhouse gas emissions. For example, a trip to Southeast Asia with a flight distance of around 9,000 km generates over 6 t of CO₂eq (calculated using ecopassenger.org).
Links
-
Umweltbundesamt (2020): Ökologische Bewertung von Verkehrsarten
-
CO₂-Berechnung in der Logistik: Datenquellen, Formeln, Standards, ISBN-10: 3574260954
-
Umweltbundesamt (2020): Emissionen des Verkehrs
-
EcoTransit World’s emissions calculator for freight transport